Introduction
The spatial intensity distribution of a laser beam is one of the key parameters to understand how a laser will perform in an application [COH]. For some applications, it may be sufficient to measure the beam profile during the design or fabrication phase of the laser, for other applications, real‐time continuous monitoring during laser operation is required. For example, in some scientific applications lasers are pushed to the operational limits and continuous measurement of the beam profile is necessary to ensure that the laser is still operating as expected. Also in industrial laser cutting or welding applications, monitoring the beam quality is critical for successful operations. [WAL].
In this white paper, we will address the general need for laser beam profile analysis. Further, we will
briefly describe laser beam analysis instruments and give an overview of laser applications, in particular for infrared wavelengths.
Laser light and other sources of light
Typical light sources are for example the sun, a light bulb, a hot object, an LED or a laser beam. A laser beam however exhibits some unique characteristics:
- Spatial coherence allows a laser to be focused to a small spot in a highly concentrated area, enabling applications such as laser cutting and welding. Spatial coherence allows a laser beam to remain narrow over great distances (collimated) – it enables it to travel with a small and well‐defined divergence.
- Lasers can also have high temporal coherence, i.e., consisting of a single narrow wavelength band with very little intensity outside the central peak wavelength (monochromatic). The temporal coherence can also be used to produce pulses of light as short as a femtosecond.
- A laser beam can be varied from a continuous wave (CW) to short pulses, with high repetition rates.
- The beam profile is a unique pattern of energy distribution across the beam.
In many applications, the energy distribution, i.e., the beam profile, affects the performance of the laser or its intended purpose. Two commonly used laser beams are a Gaussian and a flat‐top beam. A Gaussian beam allows the highest concentration of focused light, whereas a flat‐top beam allows for very uniform distribution of energy across a given area. Distorted Gaussian laser beams may lead to problems with focusing. A distorted flat‐top profile will cause non‐uniform illumination.
Instrumentation
Electronic laser beam analysis tools are either mechanical scanning instruments or camera based
systems. Mechanical scanning instruments usually consist of a single detector element with a rotating drum to block the light during most of the duty cycle of the sensor. Therefore, these instruments can easily be used for high‐power lasers. Drawback however is that mechanical scanning methods can only work on CW lasers, not on pulsed lasers. For the remainder of this paper, we will focus on (infrared) camera based laser beam analysis.
When using a camera based laser beam analyser, one can measure the full laser beam profile in two-dimensions, in one single frame. Cameras can also work with both pulsed and CW lasers. A drawback of cameras, and especially infrared cameras, is that the resolution is limited to approximately the size of the pixels. As in infrared cameras the typical pixel size is rather large ‐ between 15 μm x 15 μm and 30 μm x 30 μm ‐ the minimum measurable beam size would be limited to around 120 μm. However, the use of lenses allows to re‐image a focused spot, and to improve the resolution.
For camera based laser beam analysers, attenuators typically have to be used to reduce the laser power. Usually a (set of) neutral density filter(s) is placed in the beam path to reduce the power to a level acceptable for the camera sensor.
The complete instrumentation for a camera‐based infrared laser beam profiling system that is currently used typically consists of a computer, a digital infrared camera, software to control the camera, and software to display the beam profiles and make quantitative calculations. Attenuating filters may be required, as well as a frame grabber depending on the interface of the camera.
Xenics supplies various infrared cameras that find application in laser beam profiling applications. All of these cameras come with control software and software to display a beam profile. Most Xenics cameras also come with a standard filter holder. Note that Xenics does not supply complete laser beam profiling systems – Xenics does not have software to implement quantitative calculations.
Dynamic range and signal‐to‐noise ratio
Measuring the width of a laser beam is not an easy task. The difficulty lies in the fact that laser beams do not cut off to zero at the baseline – there is always energy extending outwards. Therefore, detecting very low light levels in combination with strong illumination in the beam center is critical. In other words, cameras with good sensitivity and especially a large dynamic range are often preferred.
The dynamic range of a camera or sensor is a commonly used term to characterize the ability to measure and distinguish different levels of light. The correct expression would be “intra‐scene” dynamic range as one would compare different pixels or areas in one frame [PCO]. At the upper limit, pixels appear to be white for every higher value of intensity (saturation), while pixels appear black at the lower limit and below.
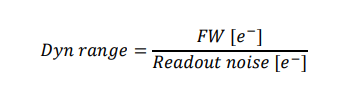
The dynamic range of a sensor or camera is defined as the maximum signal (i.e., the full well (FW) capacity, or the maximum number of electrons a pixel can collect), versus the noise in dark. If one would neglect the dark current contribution, this would then give the following equation:
Dynamic range is also often expressed in dB (decibels):

In some cases the dark current however is not negligible (for example, long exposure time and/or high sensor temperature). For these applications, one can define the usable or accessible dynamic range:
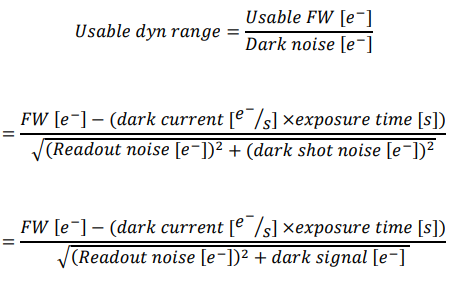
In order to have a sensor or camera with good dynamic range, ideally suited for laser beam profiling, one should select a large FW and a low read out noise. If long exposure times would be required, dark current should also be low.
Note that dynamic range of a sensor or camera is not the same as the dynamic range of the ADC (analog‐to‐digital conversion) used in that (digital) sensor or camera. For example, if a camera system uses a 14‐bit ADC, the dynamic range of the camera would normally be smaller than 214 = 16384 (or approximately 84 dB).
The (maximum) signal‐to‐noise ratio (SNR) is the dynamic range of a single pixel in a sensor or camera and should not be confused with the dynamic range of that particular camera or sensor. The SNR considers the presence of noise associated with the signal captured in a particular pixel, so that the theoretical lowest grey value as defined by the dynamic range is in general impossible to achieve on camera level.
The SNR parameter is critical for image quality and performance of each pixel. SNR can be expressed as the ratio between the signal and the overall noise:
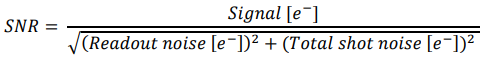
The shot noise cannot be influenced and originates from both the dark signal and signal generated by incident photon flux. The shot noise always corresponds to the square root of the number of charge carriers (electrons) generated. Note also that the SNR will always increase with increasing signal.
For a large signal, and if one can assume that the readout noise is negligible compared to the shot noise, the equation can be simplified as follows:
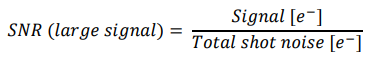
For maximum SNR (largest possible signal), this equation can be further simplified:
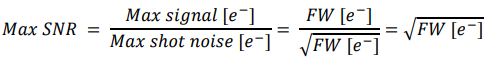
Note that under these conditions, the maximum SNR only depends on the full well capacity of the pixel. The SNR is a key performance parameter for all camera applications, including laser beam analysis. Similar to dynamic range, the SNR will benefit from a large full well capacity. Since camera based laser beam analysers typically require an attenuator (to reduce the laser power) it will be possible to have a large incident signal on the sensor.
Infrared applications and choosing a camera
Lasers are used in many scientific, telecom, defence, medical and industrial applications. The most commonly used infrared lasers are:
- Nd:YAG (Neodymium‐doped Yttrium Aluminium Garnet): These lasers emit at 1064 nm in
the near‐ or short‐wave infrared range. Many applications exist in medicine, spectroscopy
and defence. - Eye‐safe laser diodes at 1550 nm: These lasers are commonly used for telecommunications,
fibre‐optics, free‐space laser communications and laser range finders. - Laser diodes in the range between 2000 nm and 2500 nm: These lasers typically find
application in medical systems. - Quantum Cascade lasers (QCL) in the 3000 to 5000 nm wavelength range: Applications exist
in the field of infrared countermeasures and spectroscopy - Carbon dioxide (CO2) lasers centred at 9.4 and 10.6 μm: CO2 lasers are often used in
industrial welding and cutting applications [GRE], as well as for soft‐tissue surgery.
For all these infrared laser types, Xenics offers suitable and proven infrared cameras for laser beam
profiling, aligning and analysis.
In the SWIR (Short‐Wave Infrared) range, Xenics offers three types of cameras for laser beam
analysis:
- InGaAs (Indium Gallium Arsenide) in the 900 to 1700 nm range (applications 1 and 2). Also
visible‐enhanced InGaAs is available for imaging in the 500 to 1700 nm range (see Fig. 1). - T2SL (Type II Superlattice) for extended SWIR imaging in the 1000 to 2350 nm range
(application 3) (See Fig. 1) - T2SL (Type II Superlattice) for extended SWIR imaging in the 1000 to 2500 nm range
(application 3)
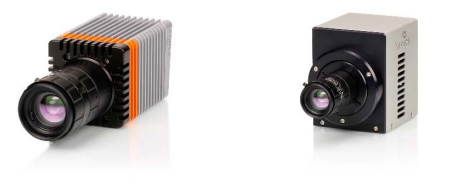
Fig. 1: The Bobcat 640 (left) & Xeva‐2.35‐320 (right) cameras.
Note that some CCD cameras have shown signal response beyond the normal cut‐off wavelength of silicon sensors, out to 1300 nm, even though the sensitivity (quantum efficiency) in this range can be significantly less than it is at 900 nm. This also reduces the dynamic range of the camera when used in this wavelength range. InGaAs based cameras are the ideal candidates for all applications in the 900 to 1700 nm range thanks to the very high quantum efficiency over the complete wavelength range.
In some cases, phosphor coated CCD cameras sensitive to wavelengths between 1140 nm and 1610 nm are used for beam profiling of, e.g., 1550 nm lasers [OPH]. This approach is quite effective when imaging a light source directly onto the array, especially with relatively large laser powers. However, due to the extremely low sensitivity of this phosphor coated Si material, it is nearly impossible to image a reflected beam off an image plane.
In the MWIR (Mid‐Wave Infrared) range, Xenics offers two types of cameras that can be used in laser beam analysis applications (See also Fig. 2):
- Broadband InSb (Indium Antimonide) in the 1.5 to 5.4 μm range (application 4)
- Broadband MCT (Mercury Cadmium Telluride) in the 1.5 to 6 μm range (application 4)
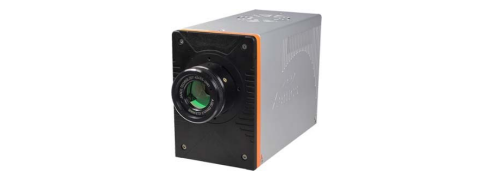
Fig. 2: The Tigris‐640, a cooled MWIR camera available with an InSb or MCT detector.
In the LWIR (Long‐Wave Infrared) range, Xenics offers a microbolometer camera (See Fig. 3) based on an amorphous silicon detector for imaging in the 8 to 12 μm range (application 5).
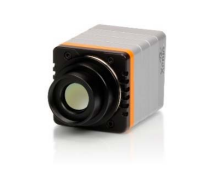
Fig. 3: The Gobi camera series for imaging in the LWIR
One of the key camera requirements for pulsed laser beam analysis is the ability to achieve high frame rates and low image lag. All Xenics cameras can operate at more than 60 Hz in full frame mode, and can be synchronized with a trigger pulse. For most cameras, a trigger pulse can be used to trigger the camera, or alternatively, the laser can be triggered from the camera.
In the SWIR range, Xenics offers high speed cameras up to 1700 Hz for a full frame of 640 x 512 pixels. In MWIR, cameras can achieve speeds of over 350 Hz.
Another essential factor for some laser beam analysis applications, is that the sensor in the camera can be windowless to eliminate interference fringes between the two surfaces. Note that this is obviously only possible for uncooled and not‐vacuum packaged sensors, i.e., for infrared sensors as discussed previously, this is only possible for InGaAs based sensors. Some of the Xenics InGaAs based cameras, can be customized to be used with a windowless detector. In case a window is required, the window should be AR (anti‐reflective) coated for the wavelength of use.
Other important features to consider when choosing a camera are:
- Variable integration or exposure time – for a short laser pulse duration a short integration
time on the camera would be preferred. A very short exposure time would also allow “quasiattenuation”
of the incident signal [COH]. - Fill factor – typically, SWIR and MWIR sensors are back‐illuminated sensors and therefore
exhibit an almost perfect 100% fill factor - Linearity – most solid‐state infrared cameras are based on CTIA (Charge‐Transimpedance
Amplifier) read‐out technology and have a very high linearity
Laser beam measurements
There are only three important laser characteristics that are unrelated to laser beam profile measurement: laser wavelength, total power (or energy), and pulse duration. These parameters can easily be measured by other instruments. All other laser beam characteristics are related to the beam profile. When the total laser power or energy is measured with a power or energy meter, the laser beam profiling system can be calibrated to this total power or energy measurement.
The peak power can easily be derived from the total power. The total power on a camera is the summation of the irradiance on each pixel and the pixel with the highest power can easily be derived in software. This is a useful measurement when the laser power is approaching the damage threshold. In addition to peak power the software can also easily find the peak pixel location.
However, note that usually the location of the centroid of the beam is more significant. The centroid is defined as the “center of mass” of the laser beam [ROU] and can be described by the following equations:
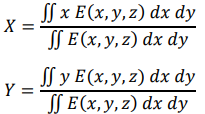
The centroid of the beam is where the energy center is located. Usually, pointing stability of a beam is measured by doing statistical analysis on the centroid [LIU] (Fig. 4 shows the high‐speed SWIR camera used in this application). The beam centroid is very important in alignment of laser beams, in order to know that the beam is positioned correctly in the optics. This plays a key role in many industrial, research and communication applications.

Fig. 4: Cheetah camera: Cheetah‐640CL 400Hz, 800Hz or 1700Hz.
The beam width gives the size of the beam at the point where measured – it is an important part of measuring divergence of laser beams, which is important in predicting the size of the beam at some other point. The divergence gives the angle at which the beam is diverging from a collimated parallel beam. The lower the divergence, the longer the beam will remain at a given beam width.
Furthermore, beam width is also essential in calculating the Beam Propagation Factor M2 of the laser (in Europe often the factor k = 1/M2 is used). M2 is often the most important characteristic as it describes the “quality” of a laser beam. A standard beam profiler is not sufficient to measure M2 however – a beam propagation analyser or M2 meter will be needed [COH].
If a laser beam with given width D is focused by a lens (with focal length f), the focused spot size and divergence can be predicted. If the beam is a pure TEM00, i.e., the fundamental transverse electromagnetic Gaussian mode, the spot size d00 equals a minimum defined by the following equation:

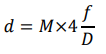
However, if the laser beam not only consists of a pure TEM00 mode, the beam will focus to a larger
spot (d), namely M times larger than the minimum spot size (d00). The beam will also diverge M
times faster than an equivalent TEM00 beam of the same width.
The ISO definition for the quality of a laser beam uses M2 as the fundamental quality parameter [ROU]. M2 quantification is not a simple operation, as it is based on several individual measurements taken at different propagated distances (beam propagation analysis), and one of the key challenges to accurately measure M2 is precise determination of the beam width.
References
[ROU] Current technology of laser beam profile measurements; Carlos B. Roundy, Spiricon Inc. [GRE] New low‐cost CO2 beam profiler eliminates need for acrylic mode burns; Lawrence Green, Ophir‐Spiricon Inc. [COH] Understand different laser beam profiling technologies available and learn how to choose the right system for your application; Coherent. [WAL] Photonics Products: Laser beam diagnostics: beam‐analysis tools each have their own approach; John Wallace, www.laserfocusworld.com [PCO] Dynamic – Dynamic Range; PCO. [LIU] Bit error rate analysis with real‐time pointing errors correction in free‐space optical communications
systems; Wei Liu et al., Optik 125 (2014) 324‐328.
[OPH] Tutorial: Why beam profiling at 1550 nm requires InGaAs cameras; Dick Rieley, Ophir Spiricon,
www.ophiropt.com/photonics
Documentation
Application Note


Related content

Jul 22nd 2026
Cooled and Uncooled Infrared Cameras :
Infrared cameras have become essential tools across a wide range of industries, from defense and surveillance to industrial inspection.

Munich.
FROM Nov 10th 2026 TO Nov 13th 2026
SEMICON EUROPA 2026
Join Exosens at SEMICON EUROPA 2026 2026 in Munich

Edinburgh.
FROM Sep 14th 2026 TO Sep 17th 2026
SPIE Sensors + Imaging 2026
Join Exosens at SPIE Sensors + Imaging 2026 Edinburgh, United Kingdom

Jul 07th 2026
Multifocal Femtosecond Laser Writing
Crosstalk Limits in Multifocal Parallel Femtosecond Direct Laser Writing: Decoherence Strategies and Quantitative Validation of Nanostructure Optical Phase

Jun 29th 2026
Exosens secures contract with BROLIS
Exosens secures major long-term contract with BROLIS to supply 17000 high-performance image intensifier tubes for the Czech Armed Forces

Jun 25th 2026
Strengthening Defense & Security Innovation
Exosens secures €140 million in EIB financing to foster innovation in Europe’s defense and security industry